What the OBSDN Guide Covers
This guide shifts the focus from price action to the underlying infrastructure of Web3 networks. While most market research relies on token prices, we prioritize node health, transaction volumes, and gas metrics. These indicators reveal the actual usage and stability of a network, offering a clearer picture of long-term viability than short-term speculation.
By leveraging infrastructure data, you can identify networks that are genuinely active and robust, rather than those driven solely by hype. This approach helps you distinguish between temporary trends and sustainable growth, providing a more reliable foundation for your market research.
The OBSDN framework is designed to help you navigate this complexity. It offers a structured way to analyze and interpret infrastructure data, ensuring that your decisions are based on concrete evidence. This method is particularly valuable in high-stakes environments where understanding the technical underpinnings of a network is critical.
We do not rely on generic sustainability claims or industry filler. Instead, we focus on specific, measurable metrics that directly impact network performance. This includes analyzing node distribution, transaction throughput, and gas fee trends to assess the true health of a blockchain ecosystem.
Tracking Node Health and Network Stability
Node distribution and sync status act as leading indicators for network reliability. When nodes are healthy and synchronized, the underlying infrastructure supports consistent transaction finality and low latency. For investors, this stability translates directly into confidence in the protocol’s ability to handle load without degradation.
A fragmented node base often precedes centralization risks or consensus failures. Monitoring these metrics helps distinguish between temporary hiccups and structural weaknesses. Reliable data sources, such as official network explorers and node operator reports, provide the most accurate view of real-time health.
Why Node Sync Matters
Sync status reveals whether new nodes are catching up with the chain head. Delays here signal congestion or hardware bottlenecks. Consistent sync times suggest a robust network capable of scaling. Conversely, widespread sync lag can indicate upcoming forks or hard forks due to software upgrades.
Interpreting Distribution Data
Node distribution across geographic regions and hosting providers mitigates single points of failure. A healthy network shows diverse participation. Concentrated node clusters increase vulnerability to regional outages or regulatory pressure. Tracking these distributions helps assess the true decentralization of the network.
Practical Monitoring Tools
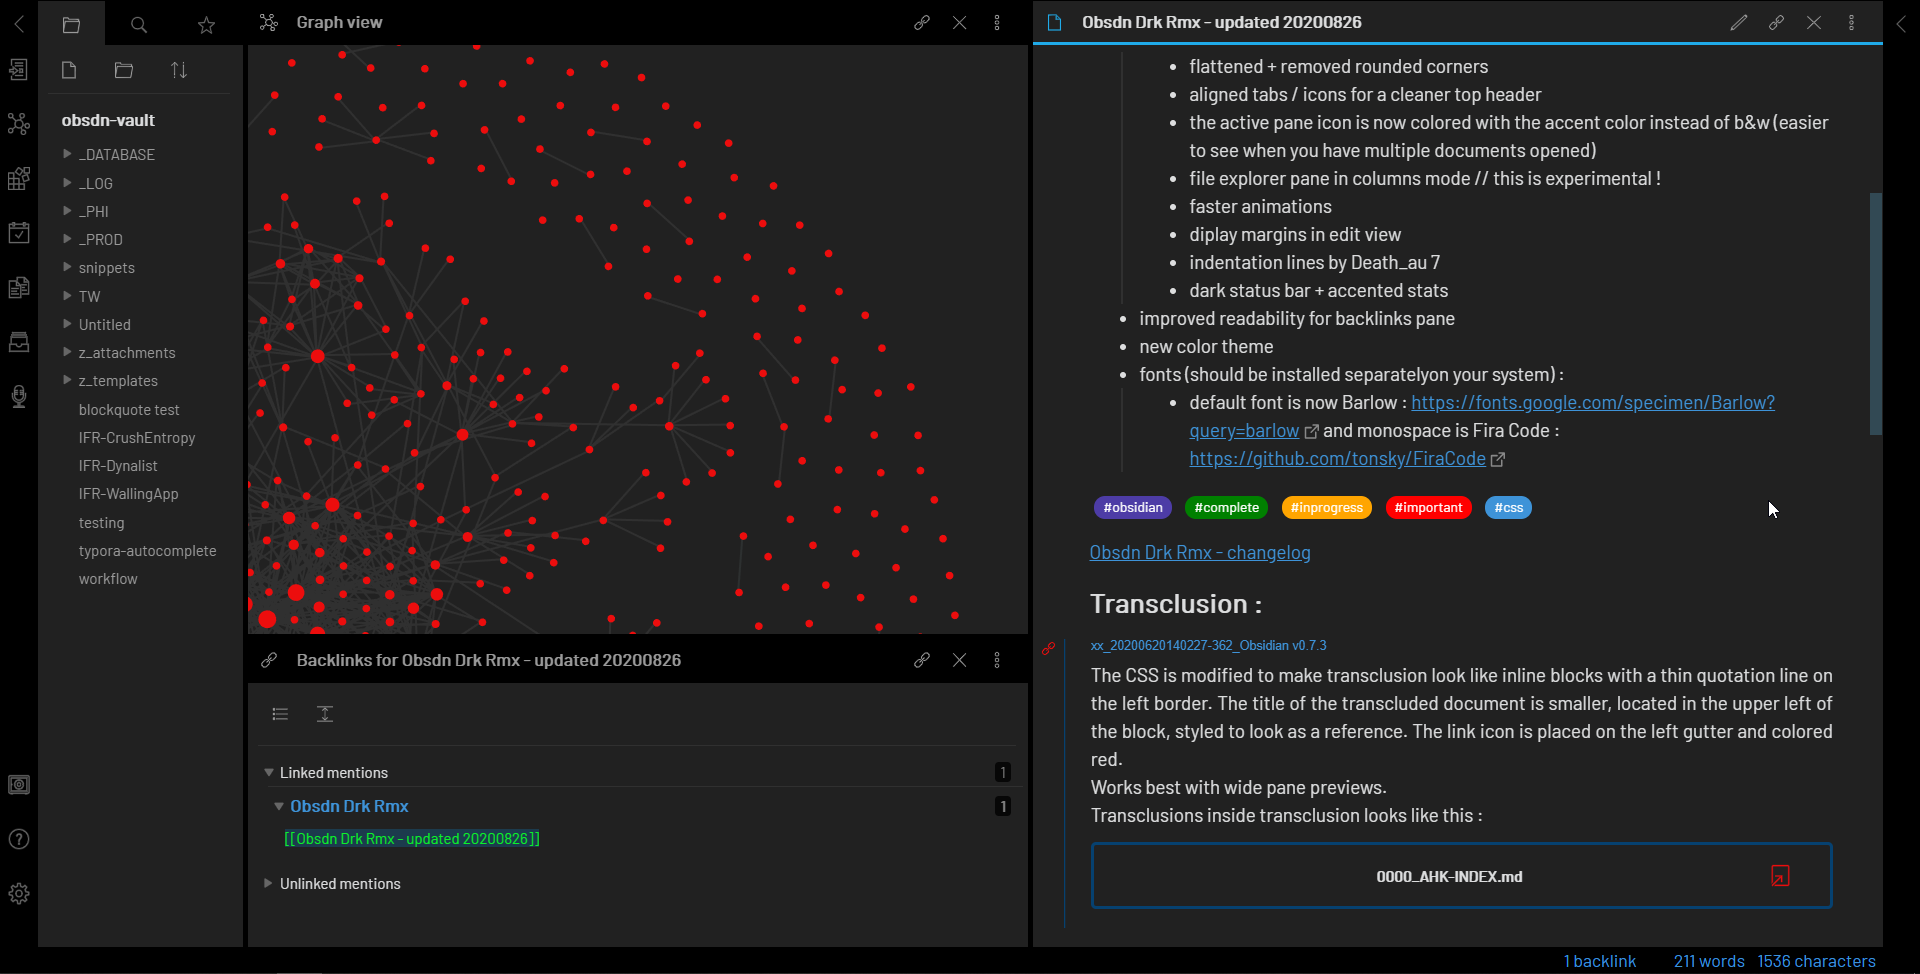
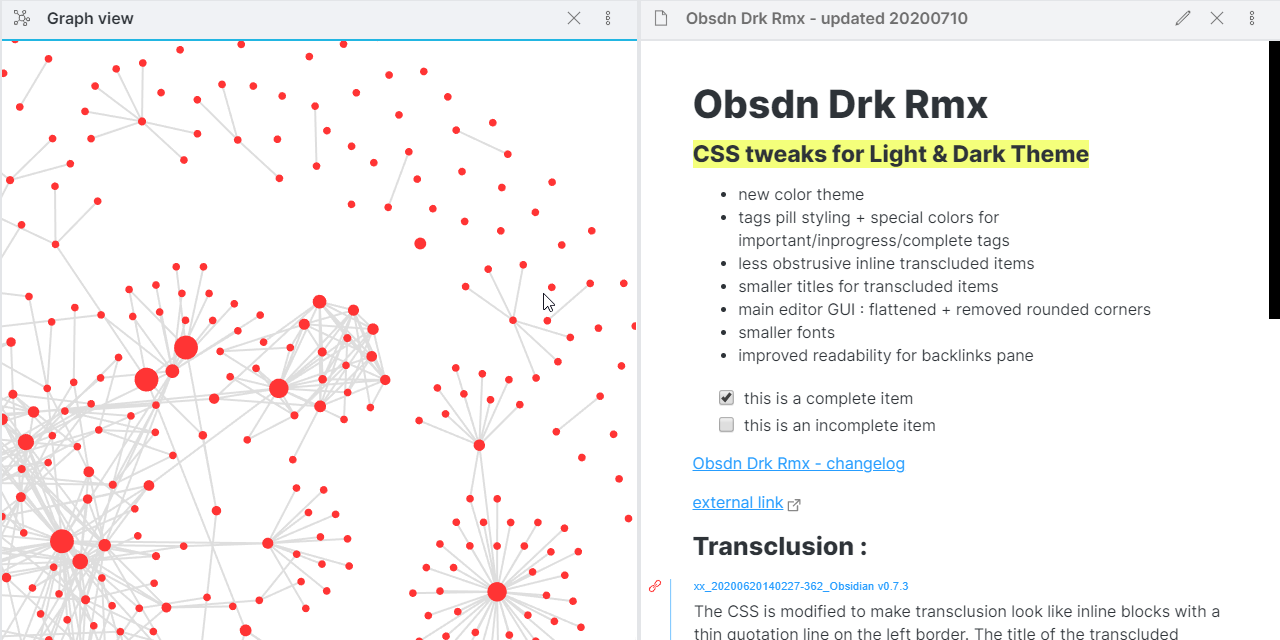
Use provider-backed widgets and official dashboards for real-time data. Static reports often lag behind current conditions. Live charts showing node count and sync time offer immediate insights into network stress. These tools allow for proactive risk assessment rather than reactive damage control.
Reading the pulse: volume and gas
Transaction volume and gas trends are the heartbeat of any Web3 network. They tell you whether people are actually using your infrastructure or just watching from the sidelines. High volume with low gas suggests organic utility. High volume with skyrocketing gas often points to speculation or congestion.
Understanding this distinction is critical for accurate market research. You need to separate the noise of bots and speculative trading from the signal of genuine user adoption.
Interpreting gas price fluctuations
Gas prices are a real-time indicator of network demand. When gas spikes, it means more people are trying to use the network than can be processed in the current block size. This isn't always bad; it can indicate high interest. But it can also mean your transaction costs are prohibitive for everyday users.
Look for patterns rather than single spikes. A consistent increase in base gas fees over weeks suggests growing organic demand. Sudden, erratic spikes often correlate with NFT mints, airdrop claims, or meme coin frenzies—events that may not reflect long-term network health.
Distinguishing speculative from organic usage
Not all transactions are created equal. Speculative usage tends to be bursty and short-lived. Organic usage is steadier and often involves more complex interactions like staking, lending, or governance.
To tell them apart, look at the diversity of addresses involved. Speculative spikes often come from a few large wallets moving funds rapidly. Organic growth shows a wider distribution of small, regular transactions from unique addresses. This distinction helps you gauge whether the network is building a community or just attracting traders.
Using transaction counts as a health metric
Transaction count alone is a blunt instrument. A million transactions could mean a thriving ecosystem or a spam attack. Context is everything.
Combine transaction counts with other metrics like active addresses and average transaction value. If transaction counts are rising but active addresses are flat, you might be seeing increased activity from a small group of power users. If both are rising, you're likely seeing genuine network expansion.
Comparing Layer 1 Infrastructure Metrics
To evaluate Layer 1 blockchains for market research, you need to look past marketing hype and focus on the raw numbers that drive network performance. The following comparison highlights three critical infrastructure metrics: transactions per second (TPS), average block time, and active addresses. These figures provide a snapshot of how each network handles load and engages users in real-time.
| Blockchain | Avg. TPS | Block Time | Active Addresses |
|---|---|---|---|
| Solana | 3,000+ | 400 ms | 1.2M+ |
| Ethereum | 15-30 | 12 sec | 500K+ |
| Cardano | 250 | 20 sec | 100K+ |
| Polkadot | 1,000+ | 6 sec | 50K+ |
Solana’s high throughput and sub-second block times make it a favorite for high-frequency applications, though it has faced occasional network stability challenges. Ethereum, while slower in raw TPS, offers unparalleled security and decentralization, with its active user base remaining the largest among major L1s. Cardano and Polkadot offer middle-ground solutions, balancing moderate speed with robust interoperability features.
For deeper technical analysis, you can track real-time performance data using provider-backed widgets. These tools help you visualize how network congestion and transaction volumes fluctuate, giving you a more dynamic view than static tables alone.
Building an OBSDN Research Workflow
Consistency turns raw infrastructure data into market insight. Instead of chasing trends reactively, a structured daily workflow lets you spot shifts in protocol health, node distribution, and network stability before they appear in price action. This process is about building a repeatable habit, not just running a query once.
Begin every session by checking the current state of the network. Look for immediate anomalies in block production times, validator participation rates, or consensus finality. A sudden drop in participation often signals upcoming governance changes or technical stress, providing an early warning for market volatility.
Monitor the geographic and client distribution of nodes. High concentration in a single region or client type increases systemic risk. If you notice a cluster of nodes going offline or switching clients, note this as a potential centralization risk that could impact network resilience during high-load periods.
Infrastructure metrics mean little without context. Cross-reference node health with transaction volume, active addresses, and gas fees. A healthy network with dropping activity might indicate a cooling market, while high activity on a strained network suggests overheating. This correlation helps you distinguish between technical glitches and genuine market sentiment shifts.

Keep a simple log of your daily observations. You don't need complex dashboards initially; a spreadsheet tracking key metrics like validator count and average block time is enough. Over time, this log reveals patterns—seasonal dips, recurring bottlenecks, or gradual improvements—that inform your long-term research thesis.
By following these steps, you build a reliable foundation for analyzing OBSDN infrastructure. This approach minimizes noise and highlights the structural changes that truly matter for market research.
No comments yet. Be the first to share your thoughts!