Start with a blank slate
When building infrastructure for high-stakes crypto market analysis, your first decision carries more weight than any plugin you’ll install later. Most researchers rush into configuring dashboards and linking external data sources before establishing a clean, logical structure. This habit creates structural debt that compounds over time, turning a research vault into a tangled web of broken links and redundant notes.
Starting with a blank slate isn’t about perfectionism; it’s about intentional design. A fresh vault allows you to map out your specific research workflow—whether that’s tracking tokenomics, monitoring on-chain metrics, or archiving market commentary—without the bias of pre-existing templates. By resisting the urge to import generic structures, you ensure that every folder, tag, and backlink serves a direct purpose in your analysis.
The OBSDN guide emphasizes that a clean start is the most critical step in building a resilient research system. When you begin with clarity, you create a system that scales with your complexity. This approach reduces cognitive load during critical market moments, allowing you to focus on interpreting data rather than navigating a cluttered interface. The initial effort to define your structure pays dividends in speed and accuracy as your research depth increases.
Create your first knowledge vault
A knowledge vault is the foundational container for your research infrastructure. In the context of OBSDN, this is where you centralize market data, thesis notes, and plugin configurations. Without a structured vault, crypto research quickly devolves into scattered folders and lost context. The vault acts as the single source of truth, ensuring that every piece of data—from on-chain metrics to macroeconomic reports—is linked and retrievable.
Start by installing Obsidian from the official site. Create a new, empty vault named CryptoResearch2026. This directory will house your markdown files, attachments, and plugin data. Keep the structure flat initially; you can organize folders later as your research depth increases. The goal is to establish a secure, local-first environment before adding complexity.
Once the vault is initialized, focus on the core OBSDN setup. This involves configuring the initial plugins that handle data ingestion and visualization. Avoid installing every available plugin immediately. Instead, prioritize those that support direct API connections to blockchain explorers and financial data providers. This ensures your research pipeline is both accurate and efficient from day one.
For detailed steps on initializing the vault and selecting the right plugins for financial analysis, refer to the official OBSDN guide. This resource provides specific recommendations for plugins that handle real-time market data and secure storage, ensuring your infrastructure is built on verified standards rather than experimental tools.
How Bidirectional Linking Connects Market Signals
In crypto research, data rarely arrives in a straight line. You might spot a correlation between a specific Layer-2 transaction fee spike and a broader Ethereum gas price trend, or notice that a whale wallet movement precedes a shift in stablecoin dominance. Without a system to capture these connections, these insights remain isolated notes. Bidirectional linking solves this by treating every note as a node in a network rather than a file in a folder.
When you link two notes together in Obsidian, you create a two-way street. If you link a note about "Bitcoin ETF flows" to a note on "Market Volatility," Obsidian records both connections. This means that when you open the volatility note, you immediately see the ETF context without having to search for it. This reverse-linking capability is what transforms a static wiki into a dynamic research tool. It allows you to see the full web of influence around any single asset or event.
This structure is essential for high-stakes financial analysis because it mirrors how markets actually work. Signals are rarely independent; they are part of a complex, interdependent system. By building a vault that emphasizes these links, you create a visual map of market logic. You can trace the origin of a price movement back through its causal chain, identifying the initial trigger and the subsequent reactions. This depth of context is what separates reactive trading from informed research.
Enable core plugins
The OBSDN guide relies on a lean set of core plugins to function as a research infrastructure rather than a simple note-taking app. For crypto market analysis, these tools bridge the gap between static text and live market data. Activating them correctly ensures your vault can track asset correlations, visualize transaction histories, and maintain a clean graph view of your research.
Graph View and Dataview
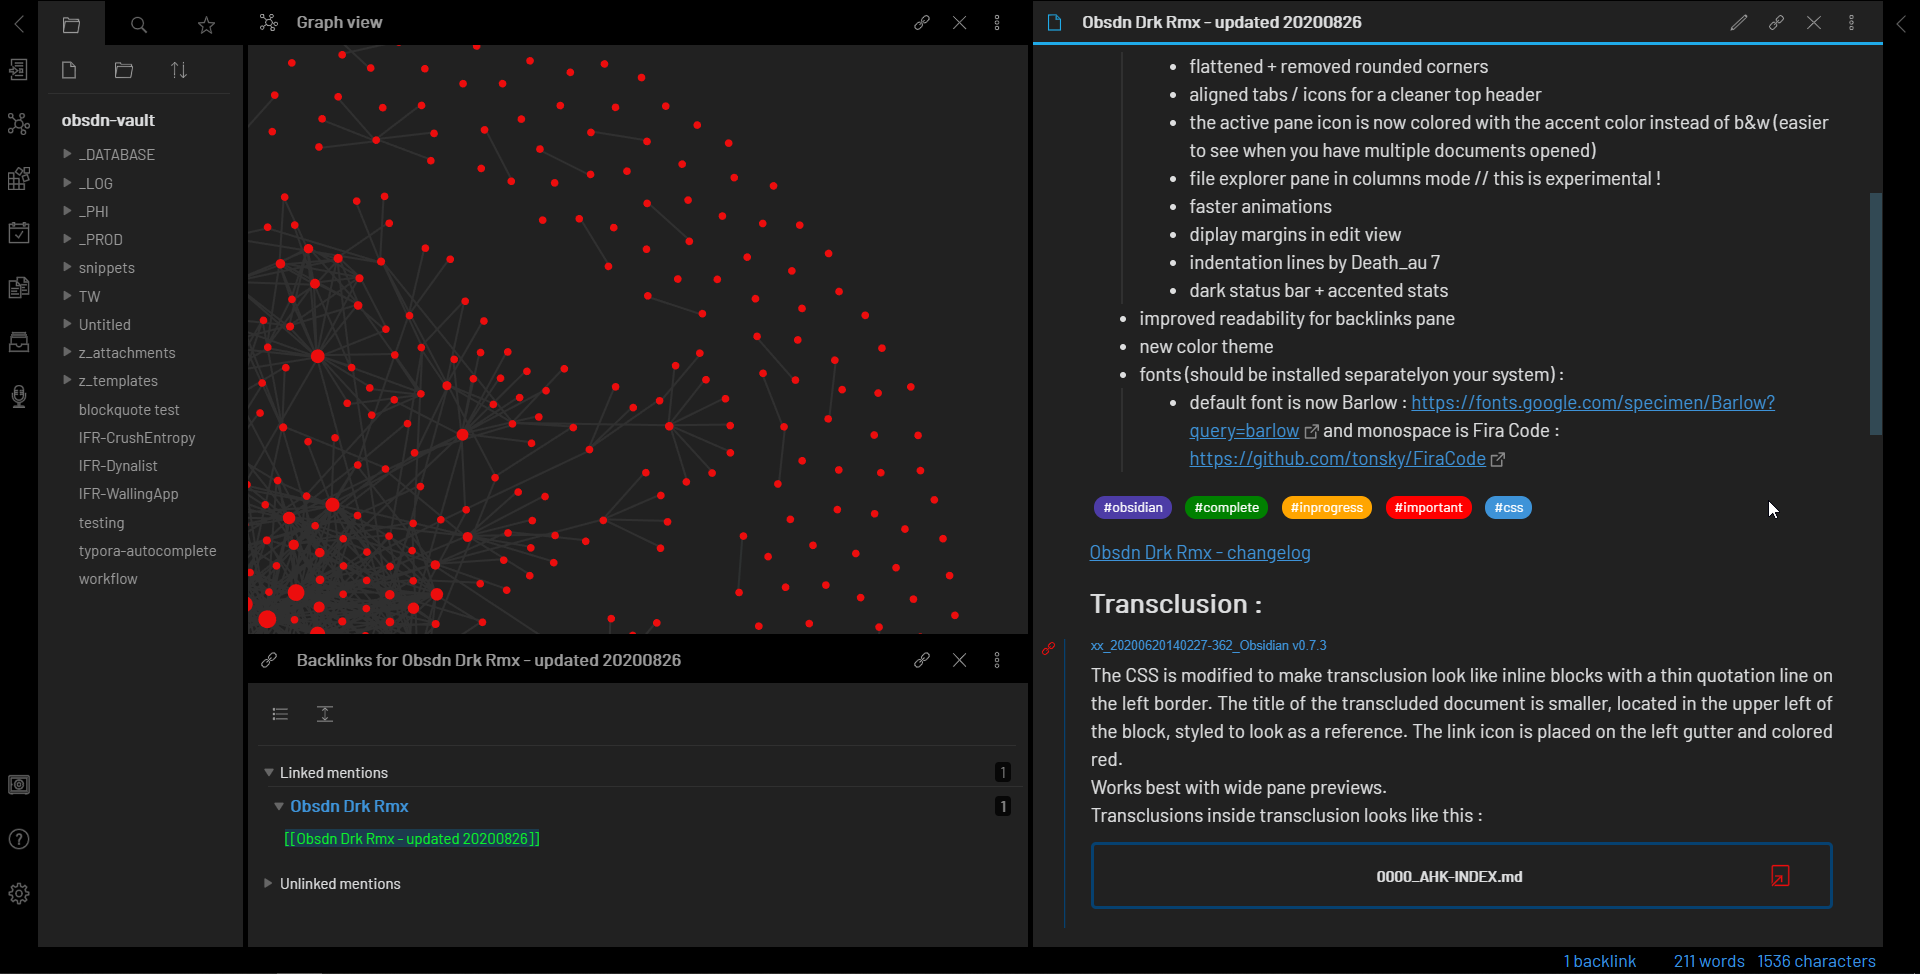
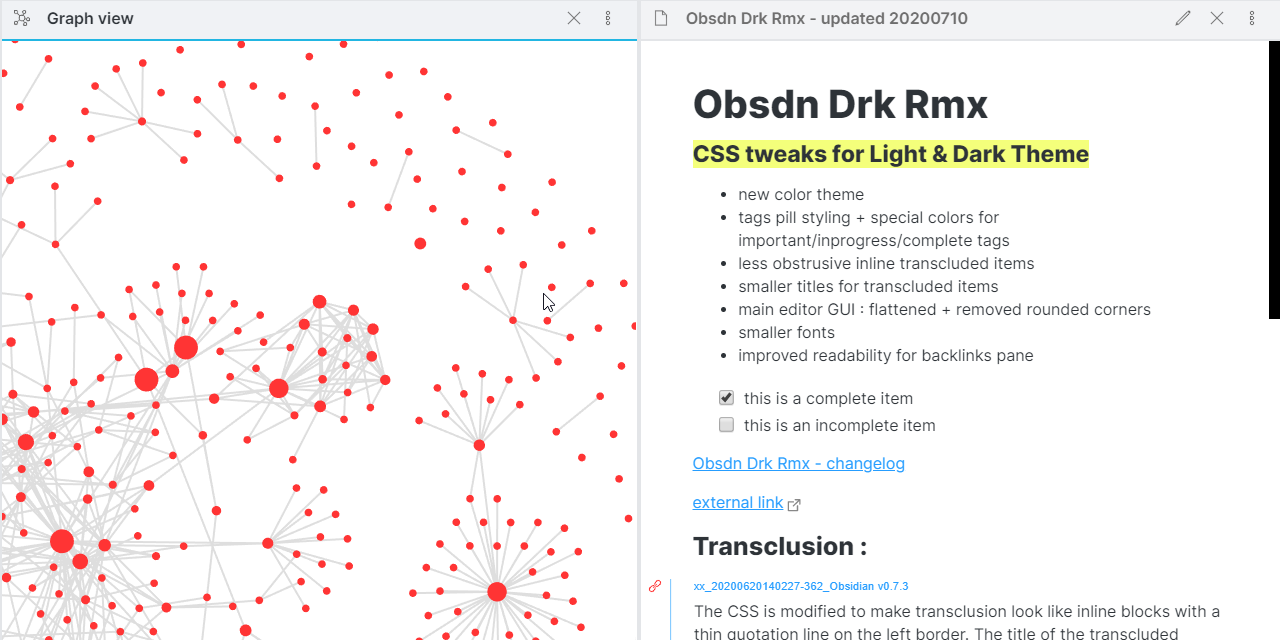
The Graph View is the central nervous system of your OBSDN guide. It transforms isolated notes on Bitcoin, Ethereum, or macroeconomic trends into a connected web of insights. By enabling the core Graph View plugin, you can visually trace how a change in Federal Reserve policy notes links to specific altcoin performance logs. This visual mapping helps identify patterns that linear text often hides.
Pair this with the Dataview plugin to automate data aggregation. Instead of manually updating tables with price points or market cap changes, Dataview queries your vault in real-time. It pulls data from your structured notes to create dynamic tables, allowing you to sort crypto assets by volatility or volume without leaving your research environment. This automation keeps your market overview current with minimal effort.
Calendar and Tasks
Market research requires discipline. The Calendar plugin integrates with your daily journaling and market review routines, providing a temporal view of your analysis. You can see exactly when you last reviewed a specific asset or when a major market event occurred. This historical context is critical for backtesting hypotheses and understanding the timeline of market cycles.
The Tasks plugin complements this by managing your research workflow. You can tag tasks with specific crypto projects or research themes, filtering them to show only high-priority analysis jobs. This ensures that no critical market update or portfolio rebalancing check slips through the cracks, keeping your OBSDN guide active and responsive to market shifts.
Technical Charting Integration
To ground your qualitative research in quantitative reality, the OBSDN guide supports technical charting. While Obsidian itself does not render complex charts natively, the ecosystem allows for seamless integration with provider-backed tools. This section focuses on visualizing the graph view of linked crypto assets alongside technical indicators.
Avoid folder overload
Rigid folder hierarchies are the fastest way to stall crypto research. In 2026, markets move too fast for static filing cabinets. If you spend more time dragging files into subfolders than analyzing data, your infrastructure is working against you. The goal is retrieval speed, not organizational perfection.
OBSDN research highlights that flexible tagging outperforms deep nesting. A single markdown file containing notes on Bitcoin’s regulatory landscape can be tagged #crypto, #regulation, #bitcoin, and #2026-policy. This allows you to pull all relevant insights across different contexts without deciding which of five folders it belongs to. Tags are fluid; folders are rigid.
The most common mistake is trying to create a "perfect" structure before you have enough data. As one community guide notes, you cannot create a perfect folder structure for new users because the taxonomy evolves with your research. Instead, start with broad categories and let tags handle the nuance. Use the graph view to discover connections your folders hide. If a file feels lost, add a tag, not a subfolder.
Keep your folder count low—three to five top-level directories is sufficient for most research vaults. Let Obsidian’s search and linking features do the heavy lifting. This approach keeps your workflow agile, ensuring you can pivot quickly when new market narratives emerge.
Install community plugins
The OBSDN infrastructure relies on a lean core, but specialized crypto market research demands extensions. Community plugins bridge the gap between static notes and live market data. These tools integrate directly into your vault, allowing you to track prices, visualize charts, and monitor news feeds without leaving your workspace.
We recommend prioritizing plugins that offer official data feeds or proven reliability. Avoid experimental tools that promise too much; in high-stakes research, stability matters more than novelty. The following comparison highlights the most effective options for crypto workflows.
| Plugin | Primary Function | Data Source |
|---|---|---|
| TradingView Charts | Interactive technical analysis | TradingView API |
| Live Bitcoin Price | Real-time price ticker | CoinGecko/CoinCap |
| Obsidian Twitter | Social sentiment tracking | X/Twitter API |
Start with the TradingView Charts plugin for deep technical analysis. It embeds live, interactive charts directly into your notes, allowing you to annotate trends alongside your research. For quick price checks, the Live Bitcoin Price plugin provides a persistent ticker in your status bar, keeping you aware of market movements without opening a browser.
For sentiment analysis, the Obsidian Twitter plugin (or similar X/Twitter integrations) allows you to curate feeds of key influencers and official project accounts. This creates a direct line to on-chain alerts and market rumors, which are often the first indicators of significant price action.
Final OBSDN Setup Checklist
Before you begin analyzing market data, ensure your OBSDN infrastructure is fully operational. A stable vault prevents data loss and ensures your research plugins integrate correctly with your crypto workflows.
Confirm your vault is created and syncs without errors. Check the OBSDN guide for setting up your first vault to ensure your core storage is secure before adding external data sources.

Activate essential plugins like Dataview and Graph View. These tools are necessary for querying your crypto data and visualizing relationships between assets and market events.
Add specialized crypto plugins for live price tracking and on-chain data. Verify that each plugin is compatible with your current OBSDN version to avoid crashes during high-volatility periods.

Run a sample query to ensure your Dataview can pull from your crypto databases. Confirm that graphs update in real-time and that no critical links are broken before starting live analysis.
With your OBSDN setup verified, you are ready to begin rigorous crypto market research. Ensure your system is stable to handle the demands of high-stakes financial analysis.
No comments yet. Be the first to share your thoughts!