Why the 2026 OBSDN guide matters now
The crypto market in 2026 operates less like a speculative casino and more like a complex, high-stakes infrastructure network. With the rise of Real World Assets (RWA) and institutional-grade blockchain integration, the margin for error has shrunk. A single overlooked vulnerability or misinterpreted tokenomic model can erase value faster than it was created. This is why a structured research methodology is no longer optional—it is the only way to plan around the noise.
The OBSDN framework was built for this exact moment. It moves beyond surface-level price action to examine the underlying mechanics of crypto infrastructure. By focusing on verifiable data rather than hype, researchers can identify which projects are building sustainable utility and which are merely riding momentum. This approach is essential for anyone serious about long-term positioning in a market that is rapidly maturing.
To understand the current landscape, it helps to look at the broader market trends. The following chart illustrates the recent performance of major infrastructure tokens, highlighting the volatility and structural shifts that define this era.
Adopting a rigorous research standard now means you are not just reacting to the market, but anticipating its moves. The OBSDN guide provides the tools to do exactly that, turning raw data into actionable insight.
Setting up your crypto research vault
Obsidian starts as a blank slate. That freedom is useful, but it’s also where most people stall. Instead of hunting for the perfect plugin theme or spending hours designing a dashboard, focus on structure first. A crypto research vault needs to handle high-velocity data without slowing you down.
Think of your vault like a trading terminal. You wouldn’t clutter your screen with decorative widgets that don’t provide actionable data. The same logic applies here. You need a rigid backbone to hold your market analysis, asset profiles, and macro trends. Once the skeleton is built, you can add plugins to make it faster.
Here is how to build a functional foundation for your crypto research.

Start with a simple, flat folder structure. Deep nesting makes navigation slow and frustrating when you’re trying to find data quickly. Create four main folders: 00_Inbox for raw ideas, 10_Analysis for deep dives, 20_Assets for coin profiles, and 30_Macro for economic trends. Keep it flat. You can always use tags to categorize later.
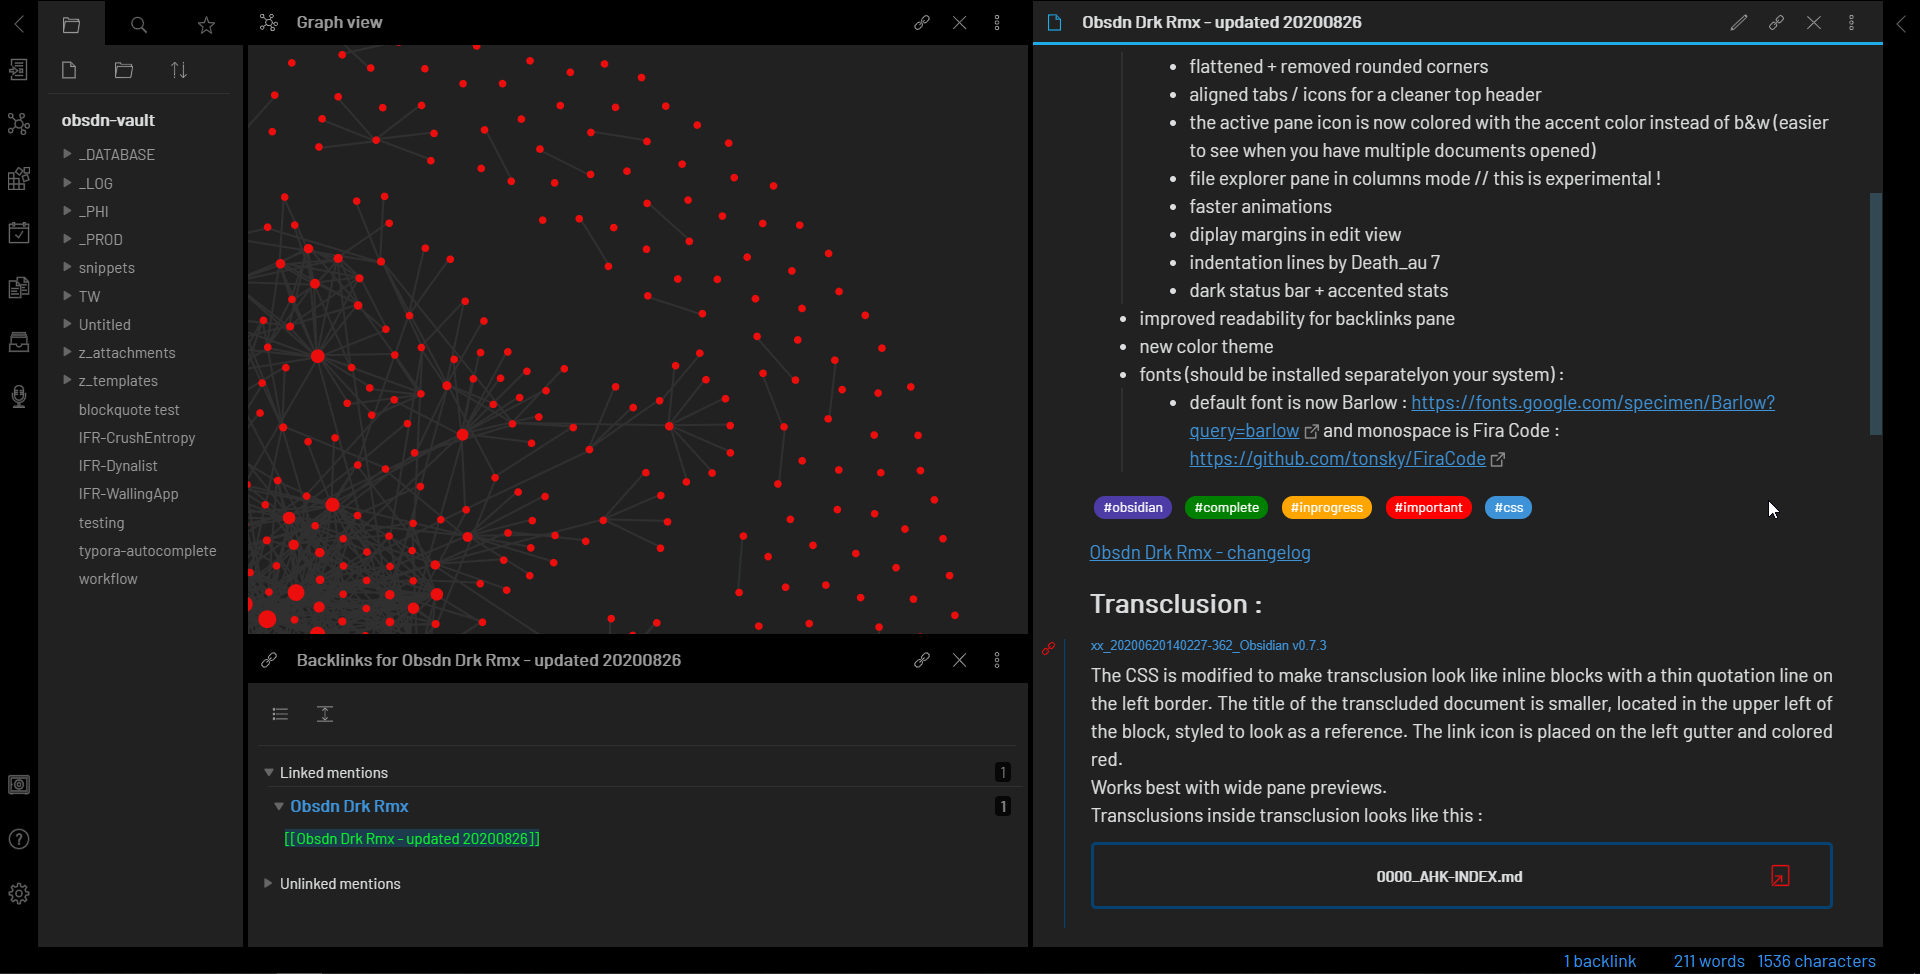
Obsidian’s core plugins are enough for 80% of research needs. Enable Daily Notes for your market journal, Templates for consistent asset profiles, and Graph View to see how your ideas connect. Don’t install community plugins yet. They often break or conflict. Master the core tools before adding complexity.
Consistency is key when tracking dozens of coins. Create a template in your Templates folder with standard fields: Ticker, Market Cap, Thesis, Risks, and Links. Use YAML frontmatter for metadata like status: active or watchlist: true. This allows you to query and filter your vault later using Dataview or simple search.

Your daily notes are where you record market movements and your emotional state. Start each day with a brief summary of price action. Note any major news or shifts in sentiment. This creates a historical record of your decision-making process, which is invaluable for backtesting your strategy later.

Obsidian’s power comes from linking. When you write about Bitcoin in your 20_Assets folder, link to related macro notes in 30_Macro. Use double brackets [[like this]] to create connections. Over time, your graph view will reveal patterns in your research that a simple folder system would hide.
Analyzing L2 infrastructure and costs
Evaluating Layer 2 solutions requires looking past marketing slogans to the actual infrastructure. The OBSDN framework prioritizes technical metrics that affect daily usage, specifically how fast transactions settle and what they cost during peak demand. When you compare these networks, you are essentially measuring the trade-off between decentralization security and user experience efficiency.
To make this comparison actionable, we break down the core infrastructure differences. These metrics determine whether a network is viable for high-frequency trading or better suited for long-term settlement. We look at throughput capacity, the time it takes for a transaction to be considered final, and the average fee per transaction. This data allows you to select the L2 that aligns with your specific research and usage needs rather than following the hype cycle.
The table below outlines the current performance profiles of major Layer 2 networks. Use these figures to gauge which infrastructure best supports your strategy, keeping in mind that gas fees fluctuate based on network congestion.
| Network | Peak TPS | Finality Time | Avg. Tx Cost |
|---|---|---|---|
| Arbitrum | 40,000+ | ~10 seconds | $0.10 |
| Optimism | 4,000+ | ~10 seconds | $0.20 |
| Base | 4,000+ | ~10 seconds | $0.05 |
| zkSync | 2,000+ | ~10 minutes | $0.15 |
| StarkNet | 10,000+ | ~20 minutes | $0.01 |
Understanding these baseline costs helps you avoid unexpected slippage or failed transactions. While some networks offer lower fees, they may require longer finality times, which impacts time-sensitive strategies. Always verify the current network status before executing large transactions, as congestion can temporarily spike costs across all L2s.
Auditing RWA Tokenization Projects
Real World Asset (RWA) tokenization promises to bring traditional finance on-chain, but it introduces a complex layer of legal and operational risk that pure crypto assets often lack. When you audit an RWA project, you are not just reviewing code; you are verifying the bridge between digital tokens and physical reality. If that bridge fails, the token may become worthless regardless of the underlying asset's quality.
Legal Wrappers and Off-Chain Enforcement
The most critical risk in RWA is the legal wrapper. A smart contract is only as good as the legal entity that holds the underlying asset. You must verify that a recognized legal entity, such as a Special Purpose Vehicle (SPV), actually holds the title to the asset. Without this, the token is just a claim on nothing.
Check if the legal documents are publicly available and if the jurisdiction offers clear enforcement mechanisms. If the asset is real estate in a jurisdiction with weak property rights, or if the legal structure is opaque, the risk of total loss is high. The token should represent direct ownership or a secured lien, not just a promise.
Oracle Reliability and Asset Verification
RWA projects rely heavily on oracles to report the status of off-chain assets. Unlike price oracles that track market data, asset oracles must verify physical existence. Did the warehouse actually contain the gold it claimed? Is the invoice for the trade finance real?
Audit the oracle's data sources. Are they third-party auditors, certified appraisers, or internal company reports? Internal reports are a major red flag. You need independent, verifiable proof that the asset exists and matches the token supply. If the oracle feed can be manipulated or if the verification process is manual and untransparent, the project is vulnerable to fraud.
Smart Contract Risks in Hybrid Systems
While the legal side is unique to RWA, the smart contract risks remain standard. However, the stakes are higher because the underlying asset is tangible. Bugs in the contract can lead to irreversible loss of value that cannot be easily recovered, unlike volatile crypto assets where market sentiment might eventually correct. Ensure the contract has been audited by reputable firms and that there are clear upgrade mechanisms or pause functions to handle emergencies.
Track market signals with live data
Static spreadsheets decay quickly. By the time you finish a manual update, the market has often shifted. To keep your research vault actionable, you need to anchor your analysis in real-time data streams rather than historical snapshots.
The easiest way to start is by embedding live price widgets for the assets you track most closely. Instead of copying and pasting prices into your notes, use provider-backed widgets that update automatically. This ensures your vault always reflects the current state of the market without requiring constant manual intervention.
For deeper analysis, integrate technical charts directly into your research entries. A live chart allows you to annotate key support and resistance levels, track volume spikes, and monitor momentum indicators like RSI in real time. This transforms your vault from a static record into a dynamic workspace where market context is always visible.
By prioritizing live, provider-backed data, you reduce the risk of basing decisions on stale information. Your research becomes a living document that evolves with the market, keeping your insights relevant and your strategy responsive.
No comments yet. Be the first to share your thoughts!