Why this OBSDN guide matters now
The 2026 crypto landscape is shifting from speculative hype to infrastructure reality. Layer 2 networks are no longer experimental sidecars; they are the primary rails for transaction volume, capital efficiency, and institutional adoption. Tracking these developments requires more than watching price charts—it demands a structured research framework that can separate genuine network utility from marketing noise.
OBSDN provides that framework. By focusing on clear research methodologies and practical market context, we help readers understand the complexity of L2 infrastructure without getting lost in technical jargon or disconnected narratives. This guide isn't just about what's happening; it's about how to analyze what's happening with precision.
The stakes are high. Capital allocation decisions in this sector influence the entire Web3 ecosystem. A flawed research approach leads to missed opportunities or, worse, significant losses. That's why we prioritize official sources, primary data, and provider-backed tools over rumors and secondary commentary.
ETH Market Context
To understand the L2 infrastructure narrative, you first need to understand the base layer. Ethereum remains the settlement layer for most L2 solutions, making its health and price action a critical indicator of sector-wide momentum.
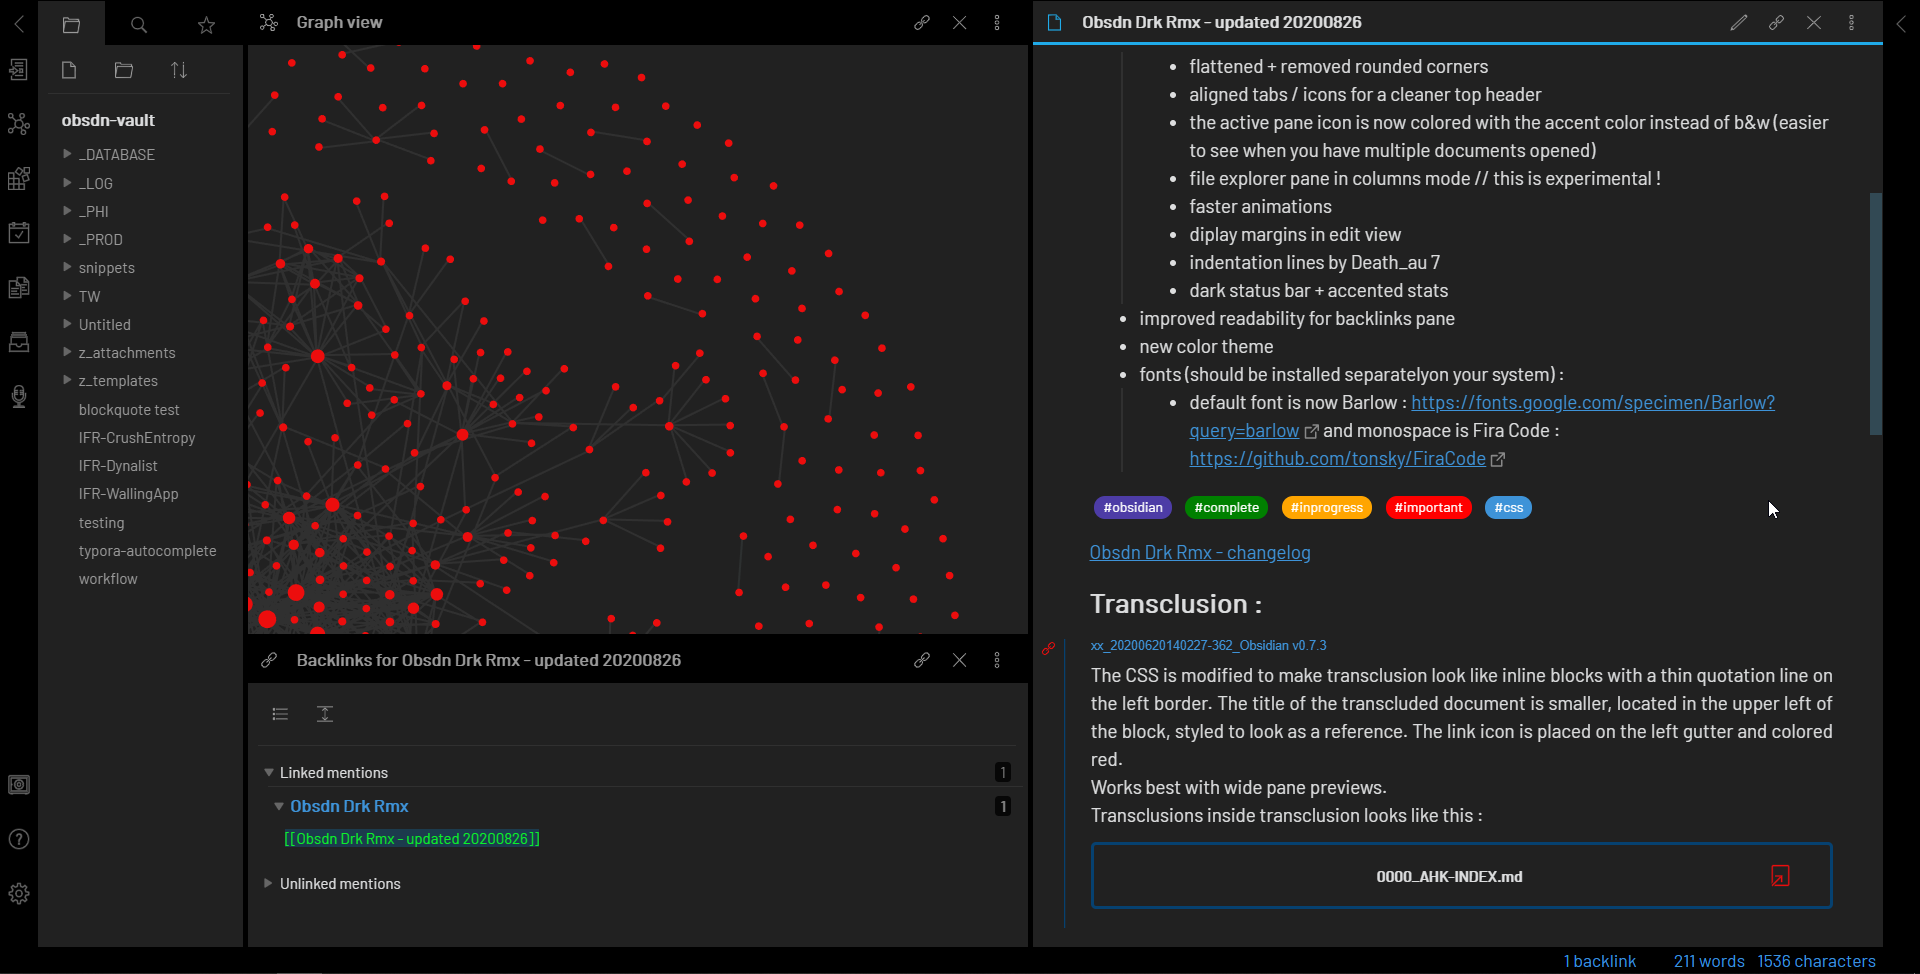
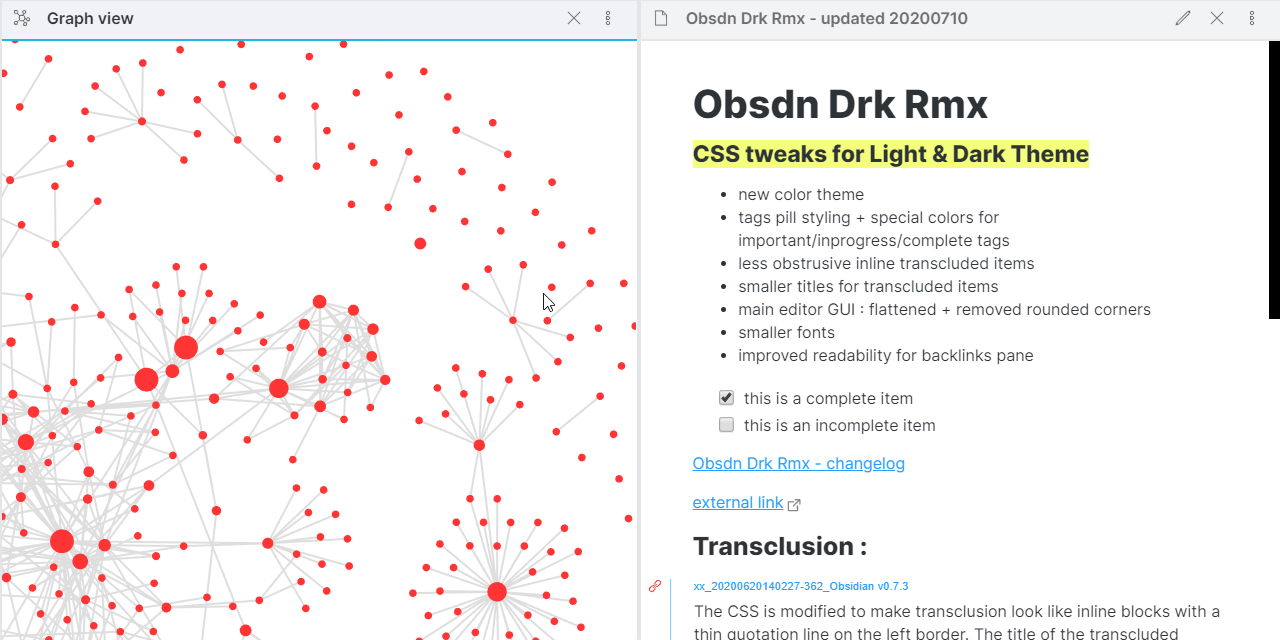
Setting up your research vault
A crypto research vault needs to move as fast as the market it tracks. If you spend more time organizing folders than analyzing charts, the tool is working against you. The goal is a minimalist workspace that prioritizes connectivity over rigid hierarchy. You should start with a clean slate, linking notes to each other rather than burying them in deep folder structures. This approach allows your knowledge base to grow organically, mirroring the complex relationships between tokens, protocols, and market cycles.
Begin by enabling Daily Notes for rapid capture. When you spot a new opportunity or a sudden market shift, you need a place to dump the raw data immediately without worrying about where it belongs yet. Once the day ends, you can review those entries and link them to your permanent notes. This separation of capture and organization keeps your workflow frictionless during high-volatility periods.
Build a Home Map of Content (MOC) to anchor your vault. Instead of moving through a tree of folders, your Home MOC acts as a dashboard, linking to your active research, watchlists, and key market indicators. This central hub ensures you always know where to find your most critical assets. Keep the structure simple; add complexity only when it directly serves your analysis.


The effectiveness of your vault depends on its ability to adapt. As market conditions change, so should your structure. If a new sector emerges, create a dedicated MOC for it. If a protocol evolves, update your linked notes accordingly. The vault is not a static archive; it is a living system that reflects the current state of your research and understanding of the crypto market.
How to Track L2 Infrastructure Shifts
Layer 2 scaling isn't a static finish line; it's a moving target. Fees drop, throughput spikes, and security models evolve as new rollups launch and existing ones upgrade. To stay ahead, you need a framework that tracks these shifts in real time rather than relying on outdated benchmarks.
The OBSDN approach focuses on three core metrics: transaction costs, network throughput, and the underlying security model. By monitoring these variables, you can identify which L2s are gaining traction and which are lagging behind market demands. This isn't about hype—it's about data.
The table below compares key infrastructure metrics for major Layer 2 networks. Use this as a baseline for your market research, but always verify current fees against live on-chain data, as gas prices fluctuate with network congestion.
| Network | Rollup Type | Avg Fee (USD) | Theoretical TPS | Security Model |
|---|---|---|---|---|
| Arbitrum One | Optimistic | 0.10 | 40,000 | Ethereum DA + Fraud Proofs |
| Optimism | Optimistic | 0.12 | 40,000 | Ethereum DA + Fraud Proofs |
| Base | Optimistic | 0.05 | 40,000 | Ethereum DA + Fraud Proofs |
| zkSync Era | ZK | 0.08 | 10,000 | Ethereum DA + ZK Proofs |
| StarkNet | ZK | 0.06 | 130,000 | Ethereum DA + ZK Proofs |
When evaluating these numbers, keep in mind that "average fee" is a snapshot. During peak usage, costs can spike significantly. Always check the current gas price on the network before executing large transactions. For broader market context, track the price movement of the underlying assets to gauge investor sentiment toward each ecosystem.
Analyzing Sustainable Yield
Finding yield in the L2 ecosystem requires looking past the headline APY. Many projects advertise high returns by subsidizing liquidity with inflationary token emissions. This creates a fragile loop where the token price drops faster than the yield accumulates, leaving early adopters with devalued assets.
To evaluate sustainability, you need to separate protocol revenue from token emissions. Look for L2s that generate actual fees from transaction activity rather than relying solely on external grants or token printing. A healthy yield comes from real usage, not artificial incentives.
Use the chart above to contextualize ETH’s price action against L2 token performance. If an L2 token is bleeding value against ETH while promising 20% APY, the yield is likely unsustainable. Always check the token’s emission schedule and vesting cliffs. High yields are often a signal of high risk, not high opportunity. Focus on protocols with transparent revenue models and long-term tokenomic designs.
Weekly Review Process
The OBSDN workflow relies on a clean vault, linked notes, and daily capture, but without a weekly review, the system stagnates. This review cycle is the maintenance phase that transforms raw data into actionable intelligence.
Consistency here prevents the accumulation of fragmented notes and disconnected ideas. By setting aside time each week to audit your links, update tags, and prune obsolete information, you maintain the structural integrity of your research. This practice ensures that your knowledge base remains a reliable tool rather than a digital graveyard.
The process is straightforward: check for broken links, verify that daily notes are properly categorized, and ensure that your home map reflects current priorities. This habit keeps the OBSDN system responsive and aligned with your evolving market research goals.
No comments yet. Be the first to share your thoughts!