Why the 2026 OBSDN guide matters
The post-halving market has shifted from speculative hype to infrastructure reality. In 2026, the difference between sustainable crypto operations and systemic failure lies in data integrity and transparent node management. The OBSDN guide addresses this shift by providing a strategic framework for navigating the complexity of modern crypto infrastructure.
This guide serves as a practical roadmap for operators, developers, and investors who need to understand the underlying mechanics of Web3 networks. Rather than chasing short-term price movements, the OBSDN approach emphasizes the robustness of the nodes that secure transactions and validate consensus.
By prioritizing clear research and practical implementation steps, the OBSDN guide helps stakeholders make informed decisions about their technical stack. It cuts through the noise of vendor marketing to focus on what actually matters: reliable, verifiable, and efficient infrastructure components that can withstand market volatility.
Build the OBSDN Guide Vault
The OBSDN guide relies on a single, powerful mechanism: connecting your research in one place. Instead of jumping between Twitter, CoinGecko, and news sites, you build a personal knowledge base. This turns scattered market data into a structured asset. You aren't just storing notes; you are building a map of the market.
Obsidian treats a "vault" as a local folder on your computer. This is critical for high-stakes finance. Your research stays offline, secure, and under your control. There is no cloud lock-in or subscription fee for the core software. You own the data, and you own the structure. This independence is the foundation of the OBSDN guide.
Step 1: Create the Home MOC
Start by creating a "Map of Content" (MOC) file. This acts as your dashboard. It links to your major categories: Bitcoin, Ethereum, Layer 2s, or specific sectors. Think of it as the index of a book. Without it, your vault is just a messy drawer. Every piece of research should eventually link back here.
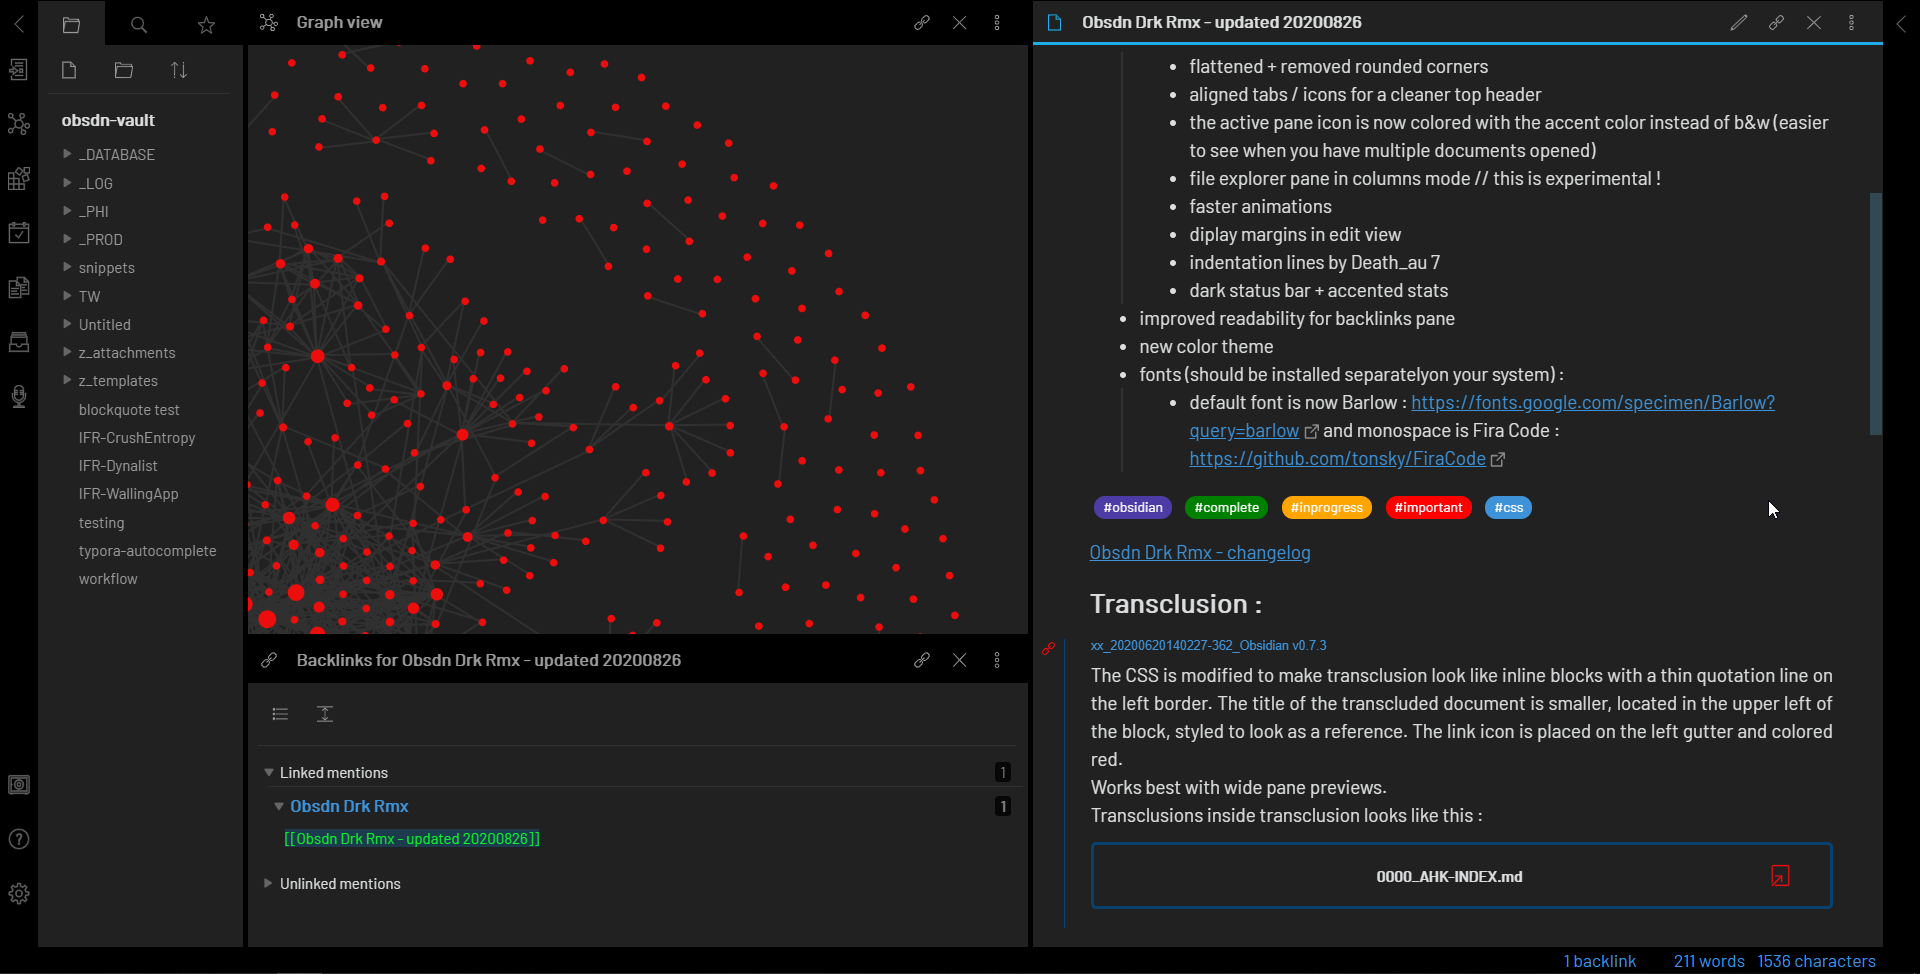
Install Obsidian and create a new folder for your crypto research. Name it clearly. This folder is your vault. Open it in Obsidian to begin. This local storage ensures your proprietary analysis remains private and accessible without internet latency.

Create a file named Home MOC. Use this page to link to your primary topics. For example, link to Bitcoin, Ethereum, and Regulation. This creates the top-level navigation for your OBSDN guide. It keeps your workflow focused on specific assets rather than getting lost in general notes.

Turn on the Daily Notes plugin in settings. This creates a new note for every day. Use these notes for quick market observations, price movements, or breaking news. Link these daily entries to your main MOC files. This builds a chronological timeline of your research alongside your structured data.
Step 2: Structure for Speed
In crypto, speed matters. Your OBSDN guide must be fast to navigate. Use folders sparingly. A flat structure with many links is often better than deep nested folders. When you find a new protocol, create a note for it immediately. Link it to your Home MOC. Add tags like #defi or #infrastructure to group similar assets.
This approach mirrors how the brain works. You make connections as you go. Instead of searching for a file later, you find it through the links you already created. The OBSDN guide becomes a living document that grows with the market. You aren't just reading about crypto; you are mapping it.
Step 3: Link Everything
The power of the OBSDN guide comes from linking. If you read an article about Ethereum gas fees, link that note to your Ethereum MOC. If you analyze a specific Layer 2, link it to both Ethereum and Layer 2. This creates a web of knowledge. You can see how different parts of the market interact.
This method prevents siloed thinking. You start to see patterns. Maybe a regulatory change affects multiple coins. Your links will show you all the affected assets at once. This is how you build institutional-grade research on a personal laptop. The OBSDN guide turns raw data into actionable insight.
Tracking infrastructure and bridges
The OBSDN guide treats crypto infrastructure not as abstract code, but as critical financial plumbing. When you monitor ZK provers and cross-chain bridges, you are essentially watching the load-bearing walls of the ecosystem. A crack in either foundation can ripple through markets faster than any news headline. This section details how to apply the OBSDN methodology to these specific high-stakes components.
Monitoring ZK Prover Reliability
Zero-knowledge provers are the computational engines behind modern scalability. Their reliability determines whether transactions settle quickly and securely. The OBSDN guide emphasizes tracking prover uptime and proof generation latency as primary health indicators. If a prover falls behind, the entire rollup it supports may experience delays or become vulnerable to reorgs. You should monitor official prover dashboards for real-time status updates rather than relying on third-party aggregators that may lag.
Assessing Cross-Chain Bridge Security
Cross-chain bridges are the most frequent target of exploits because they move value between incompatible systems. The OBSDN guide advises a strict focus on lock-and-mint mechanisms versus wrapped asset models. Lock-and-mint bridges generally offer better security guarantees because the underlying assets remain in custody rather than being duplicated. When evaluating a bridge, check if the protocol has undergone independent audits and if its multi-sig signers are transparently listed. High-value bridges should have clear, public incident response plans.
Comparing Infrastructure Components
To help you decide which infrastructure metrics matter most, the table below contrasts the key monitoring points for ZK provers versus cross-chain bridges.
| Component | Primary Metric | Key Risk | Official Source |
|---|---|---|---|
| ZK Prover | Proof Latency | Circuit Breakdown | Prover Dashboard |
| ZK Prover | Uptime % | Compute Shortage | Block Explorer |
| Bridge | TVL Lockup | Multi-sig Compromise | Bridge Contract |
| Bridge | Finality Time | Liquidity Drain | Audit Reports |
Using the OBSDN guide as your baseline ensures you are watching the right levers. By focusing on prover latency and bridge lockup values, you gain visibility into the actual health of the network, not just the price action on top of it.
Reading the Market with OBSDN
A structured note is only as useful as the data it interprets. In the OBSDN guide, market analysis isn't about predicting the future; it's about recognizing current conditions with precision. By integrating live technical charts with your research workflow, you move from passive observation to active strategy. This section shows how to anchor your OBSDN notes in real-time price action.
Start by anchoring your analysis in the current price. Bitcoin sets the tone for the broader crypto infrastructure market, and its volatility dictates risk parameters for every other asset. Use a live price widget to keep the current valuation front of mind, ensuring your structured notes reflect the exact moment of analysis rather than stale historical data.
Next, layer technical context. A candlestick chart reveals momentum, support levels, and potential breakout points that raw price data obscures. Embed a TradingView chart directly into your OBSDN research to visualize these patterns. This visual aid allows you to spot trends and correlations between Bitcoin and altcoins without switching between tabs, keeping your focus on the infrastructure narrative.
The goal is to merge these live signals with your qualitative OBSDN findings. When the chart shows oversold conditions alongside positive infrastructure developments, you have a high-conviction signal. This combination of quantitative technicals and qualitative research forms the backbone of a robust crypto strategy, turning noise into actionable intelligence.
Your 2026 OBSDN strategy checklist
Turn the OBSDN guide into a working system with these five steps. This checklist ensures your infrastructure is built for speed, security, and long-term reliability.
Start by creating a central Hub or Map of Content (MOC). This acts as the entry point for your entire knowledge base, preventing data from scattering across unrelated folders.
Activate the core Daily Notes plugin. This creates a timestamped file every day, serving as the default landing page for quick captures and time-sensitive logs.
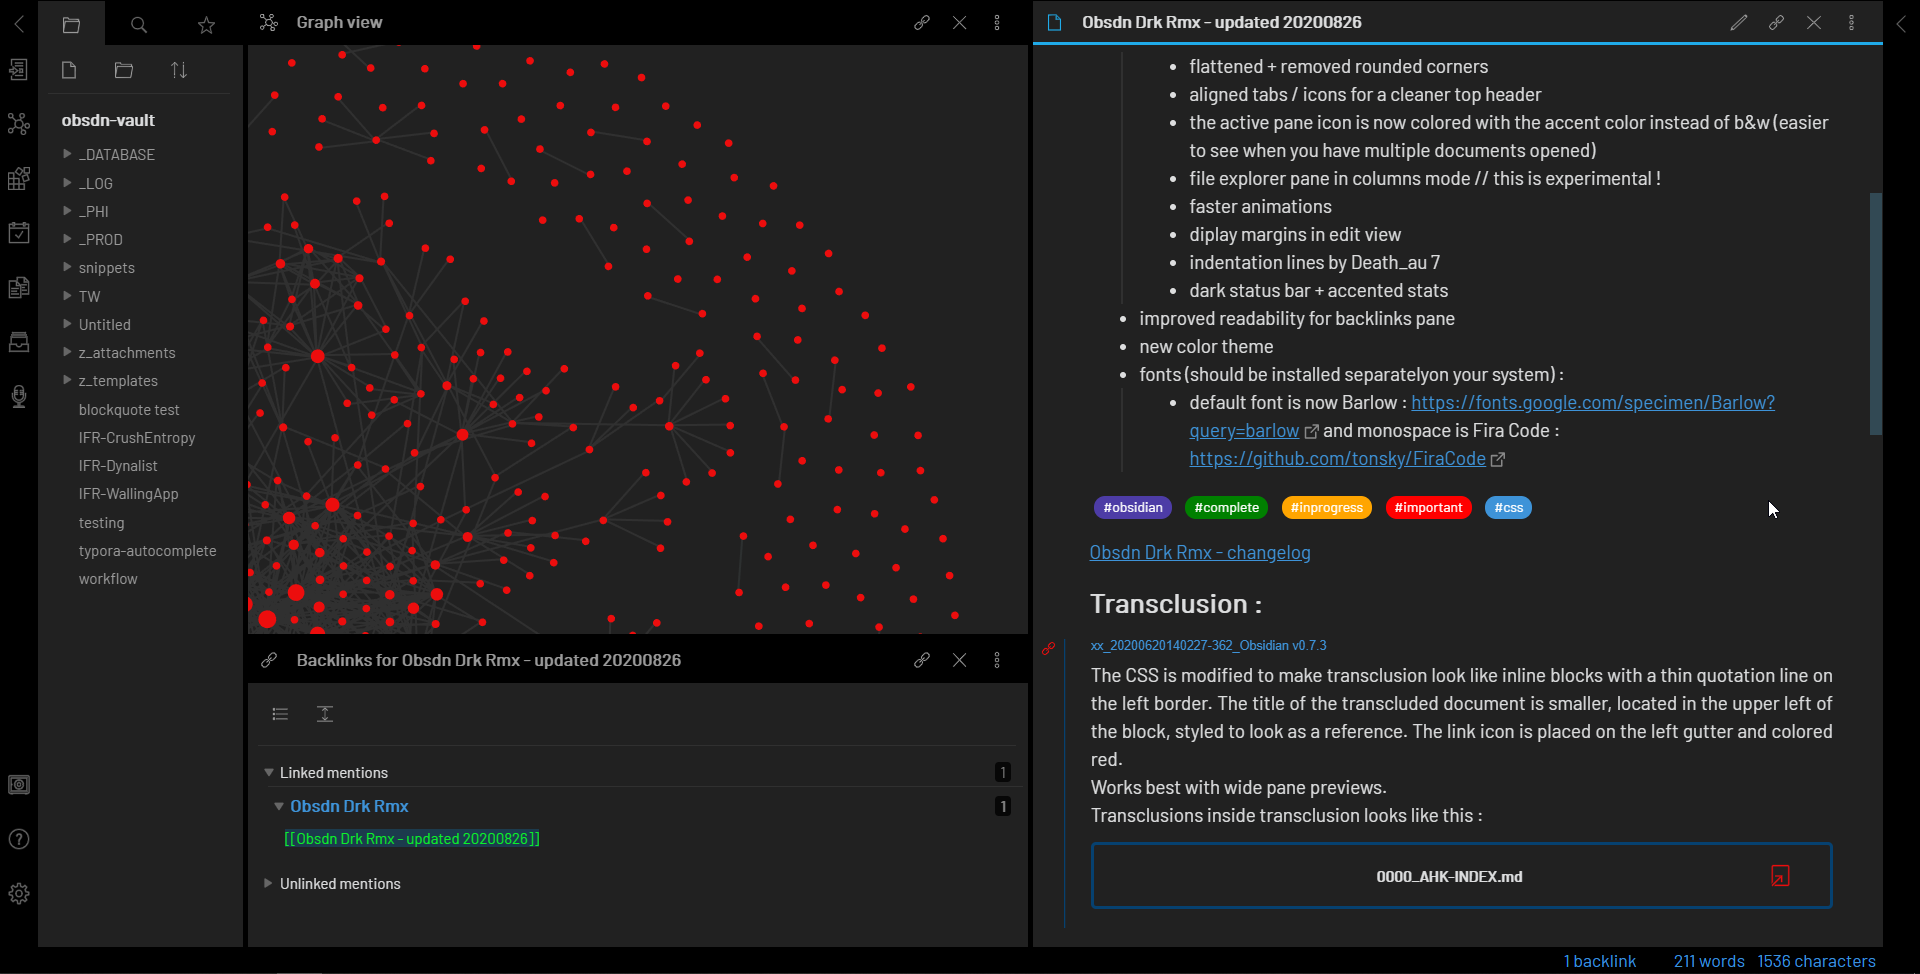
Break complex ideas into single-concept files. Atomic notes are easier to link, search, and repurpose, keeping your OBSDN guide lean and highly interconnected.
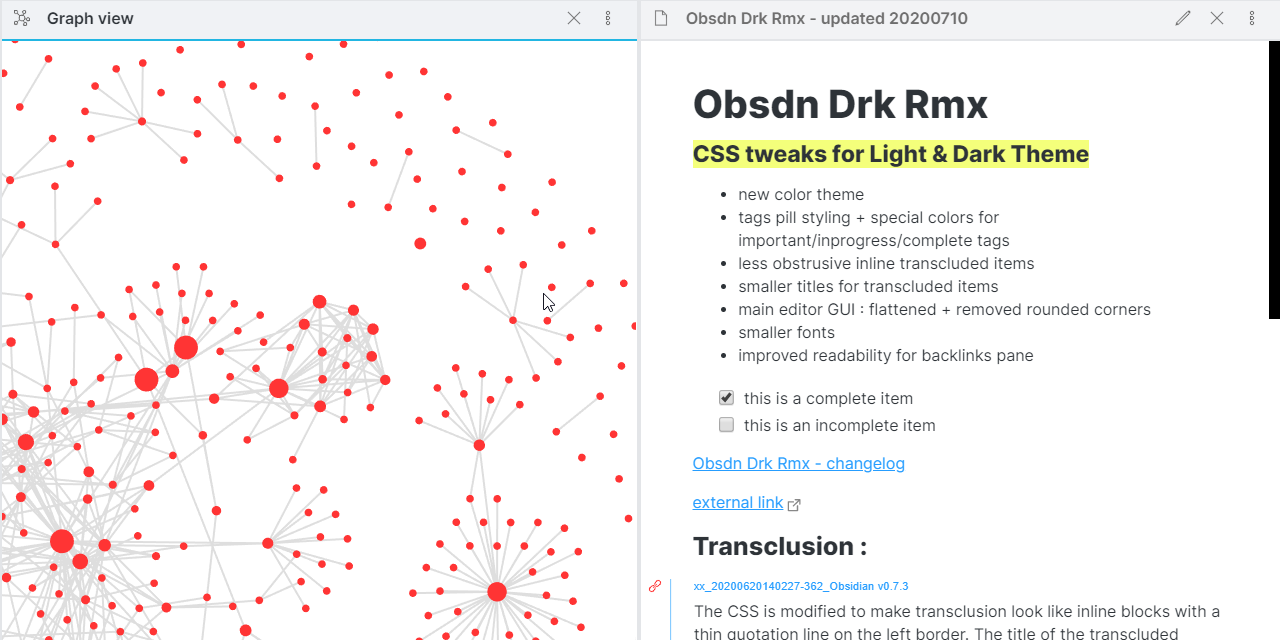
Keep your folder structure minimal. Use broad categories for main workflows and rely on tags and links for granular organization to avoid rigid silos.

Schedule a weekly review to link new notes to your MOC and archive completed tasks. This maintenance ensures your OBSDN guide remains a trusted, up-to-date asset.
No comments yet. Be the first to share your thoughts!