Why your obsdn infrastructure needs an upgrade
The gap between static note-taking and real-time verification is where research integrity breaks down. In 2026, relying on manual logs or delayed snapshots leaves your infrastructure exposed to blind spots that automated, verified data tracking eliminates. You need systems that catch vulnerabilities before they become exploits.
OBSDN functions as an early warning system, highlighting vulnerabilities before they become exploits. By focusing on concrete, verifiable data points, it shifts the burden from reactive firefighting to proactive monitoring. This transition is not just about speed; it is about establishing a baseline of truth that holds up under audit.
Your current setup likely treats data as a historical record rather than a live signal. Updating this infrastructure means integrating tools that prioritize provider-backed sources and real-time verification. This ensures that every data point in your workflow is traceable, accurate, and ready for immediate decision-making.
Setting up your crypto research vault
Building a functional ObsDN environment starts with structure, not plugins. You need a clean slate before adding integrations. This section walks through the initial configuration required to turn Obsidian into a compliant crypto research workspace.
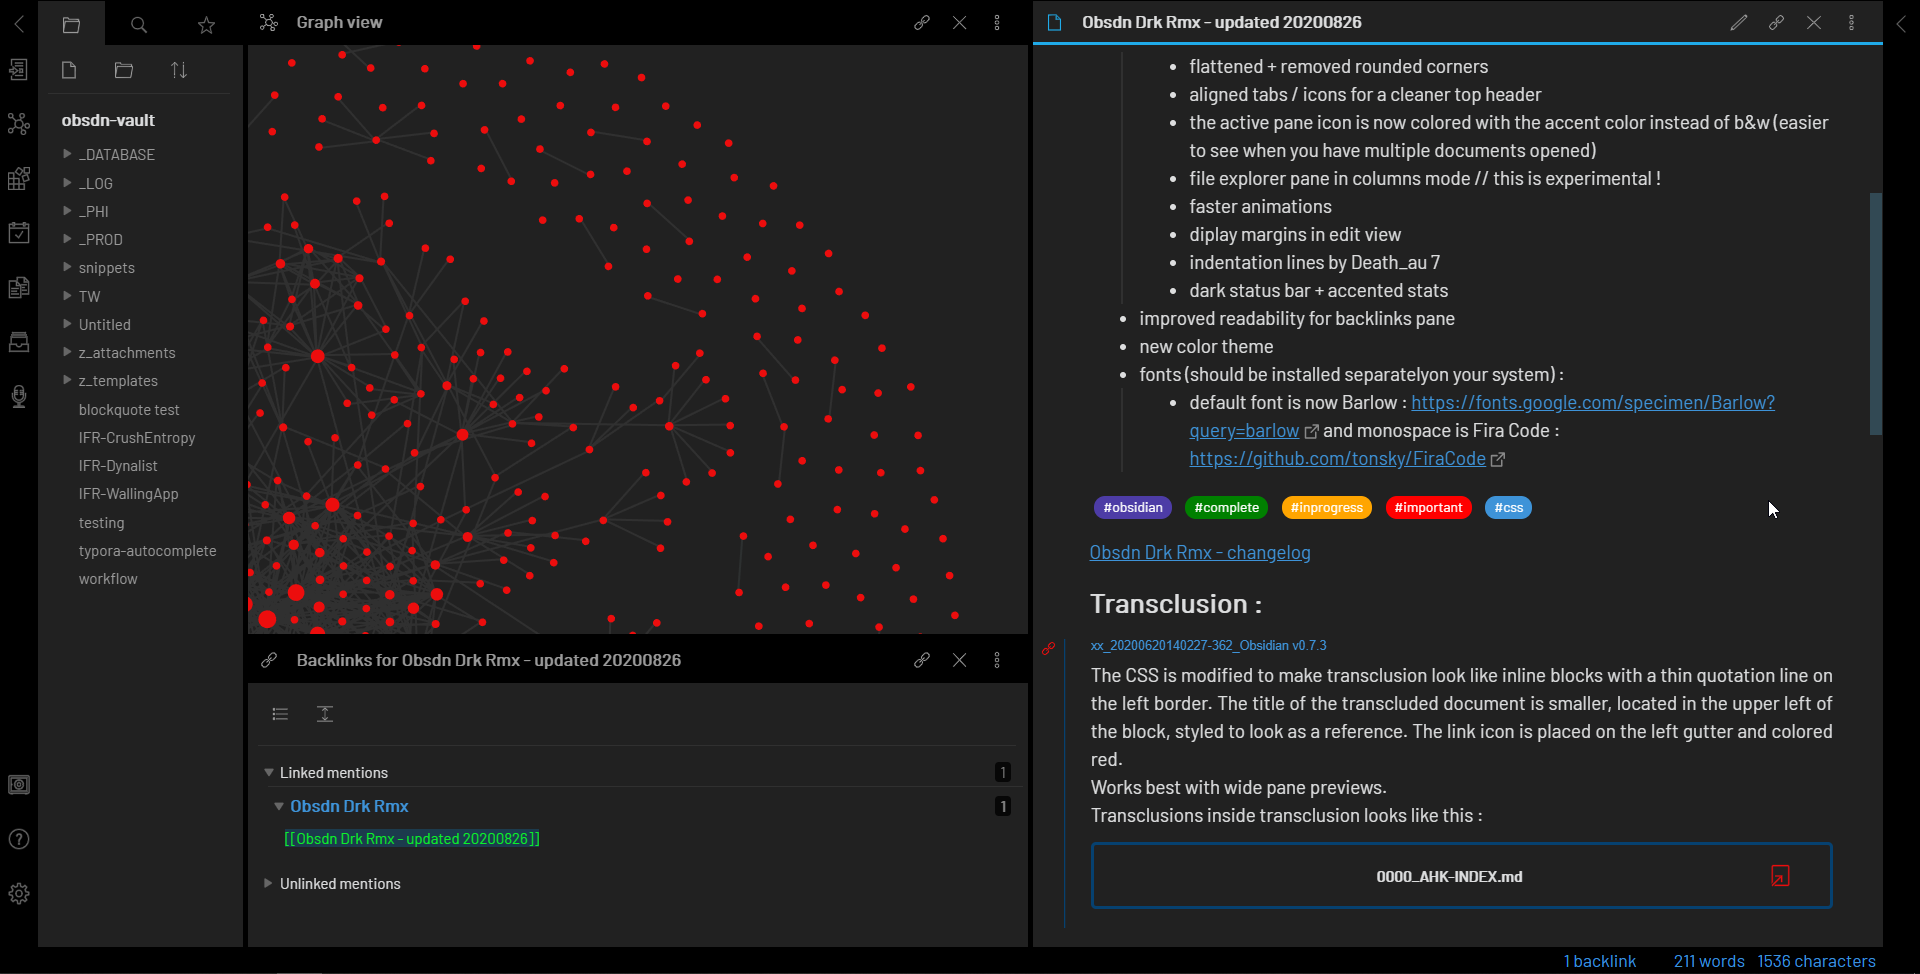
Download the official Obsidian desktop client from obsidian.md. Avoid third-party forks for financial research; you need the standard, auditable release. Verify the installation path and ensure the app runs as the primary node for your vault. This establishes the baseline for all subsequent data imports.

Create a dedicated folder hierarchy before adding content. Use a flat but categorized structure: 00_Inbox, 10_Market_Data, 20_Projects, and 30_Archive. This separation prevents data contamination. High-stakes research requires strict boundaries between raw market feeds and your analytical notes. Do not mix these streams.

Add the official community plugins that support data integrity. You need Dataview for querying structured data and Templater for consistent note generation. Install these from the Community Plugins browser after enabling Developer Mode in Settings. These tools form the backend logic of your vault, allowing you to link market metrics to specific research claims.
The setup is only as good as your data hygiene. Once the structure is in place, you must configure your external data sources. This involves linking live market widgets to your 10_Market_Data folder. Ensure every chart and price feed is attributed to a primary provider. This step is non-negotiable for audit compliance in financial research.
Tracking infrastructure metrics in real time
Static analysis tells you what happened. Real-time tracking tells you what is happening right now. For high-stakes research, the difference between a warning and a loss is measured in seconds. Integrating live data feeds into your infrastructure shifts your focus from retrospective reporting to active monitoring.
The core of this setup is the technical chart. Rather than relying on stale screenshots, you need a provider-backed widget that reflects current market conditions. This ensures your audit trail is based on live data, not archived snapshots.
This live chart serves as the primary interface for monitoring price action and volume spikes. It grounds your research in verifiable, real-time data. When combined with a live price widget, it provides an immediate snapshot of asset health without the lag of manual updates.
Beyond price, your infrastructure must ingest on-chain metrics. Tools like OBSDN act as an early warning system, highlighting vulnerabilities before they become exploits. By focusing on concrete, verifiable data points, you can detect anomalies in node behavior or transaction patterns as they occur. This proactive approach allows you to react to infrastructure shifts rather than just observing them after the fact.
Choosing between zero-knowledge provers and cross-chain bridges
Selecting the right infrastructure tool depends on whether you need to verify computational integrity or move assets across incompatible ledgers. Zero-knowledge (ZK) provers focus on validity, allowing networks to prove a transaction occurred without revealing underlying data. Cross-chain bridges, by contrast, facilitate the transfer of value between distinct blockchains, often relying on wrapped assets or liquidity pools.
The table below compares leading tools in both categories based on security models and primary use cases. Use this as a starting point for due diligence, as the landscape shifts rapidly with new protocol upgrades.
| Tool | Type | Security Model | Primary Use |
|---|---|---|---|
| Polygon zkEVM | Zero-Knowledge | ZK-Rollup (Validity Proofs) | High-throughput Ethereum scaling |
| Arbitrum Nitro | Optimistic Rollup | Fraud Proofs (7-day challenge) | EVM-compatible smart contracts |
| Wormhole | Cross-Chain Bridge | Guardian Network (Multisig) | Message passing and asset transfers |
| LayerZero | Cross-Chain Bridge | Omnichain Interoperability Protocol | Lightweight cross-chain messaging |
For readers interested in the hardware or physical security aspects of managing private keys for these tools, consider reviewing dedicated security guides.

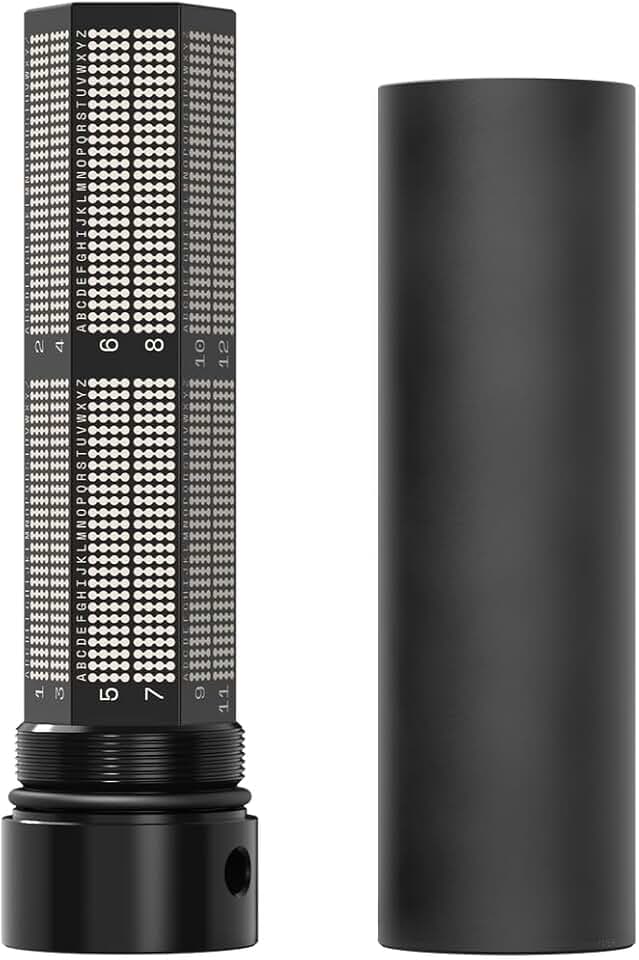

As an Amazon Associate, we may earn from qualifying purchases.
When evaluating these options, prioritize tools with audited smart contracts and transparent governance structures. For real-time market context on the assets being bridged or secured, monitor their performance via provider-backed charts.
Turning data into actionable strategies
Raw infrastructure metrics are noise until you apply a framework. You are not just collecting data; you are building a risk model. Start by isolating the specific vulnerability—whether it is a smart contract logic error or a node synchronization lag—and map it directly to your position sizing.
Do not treat every signal as a trade opportunity. Use the data to filter out false positives. If an ObsDN alert flags a potential exploit, verify it against on-chain volume spikes. A genuine threat usually precedes abnormal liquidity movement. If the volume does not follow the alert, the risk is likely overstated.
Integrate provider-backed charts to confirm your hypothesis. Use a TechnicalChart to visualize the asset's reaction to the infrastructure event. This visual confirmation helps you time entries and exits with precision, avoiding the trap of reacting to headlines rather than market mechanics.
No comments yet. Be the first to share your thoughts!